Support - S1 : 1.4195 | S2 : 1.4135 | S3 : 1.4019
Resistance - R1 : 1.4372 | R2 : 1.4488 | R3 : 1.4548
Main Trend - Bearish
Intraday Trend - Bearish
The exchange rate GBPUSD accept very strong pressure all these days, as we can see on the 4H chart of forex technical analysis. On Friday price finally, close inside lower channel of Andrew's Pitchfork exactly on the bottom line. Is very clear that the price remains below EMA(50) and EMA(200). This point is critical for the next move because right now is acting as support.
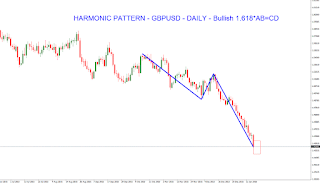
We must consider that there are Bullish Harmonic Patterns on 1H, 4H, and Daily chart.
An upward reaction is possible, but in any case, we must filter the move in order to be sure that is a real and valid reaction.
Considering all the details from the charts of forex technical analysis we can detect all critical levels and trading targets for H1 and H4 timeframes:
The area 1.4360 – 1.4395 is a neutral zone.
Bullish scenario: If price moves upwards and close above the neutral zone, then the upward trading targets will be: 1.4440, 1.4500, 1.4545, 1.4580, 1.4620, 1.4665, 1.4720.
Bearish scenario: If price moves downwards and close below the neutral zone, then the downward trading targets will be: 1.4190, 1.4150, 1.4100, 1.4060, 1.4030.
The area 1.4290 – 1.4305 is a neutral zone.
Bullish scenario: If price moves upwards and close above the neutral zone, then the upward trading targets will be: 1.4320, 1.4345, 1.4365, 1.4390, 1.4415, 1.4445, 1.4470, 1.4500.
Bearish scenario: If price moves downwards and close below the neutral zone, then the downward trading targets will be: 1.4220, 1.4185, 1.4135.
There are Bullish Harmonic Patterns on 1H chart: nen Star [0886/0.786/2.236], on 4H chart: 1.618xAB=CD, on Daily chart: 1.618xAB=CD.
Using the above elements of forex technical analysis, everyone can plan his own personal forex trading strategy. We note the need to use stop-loss levels.
You agree with our estimates? If you have another point of view, you can write your opinion in comments.
You can subscribe to one of the four subscription packages and take advantage of all benefits of the forex signals using one of the most sophisticated Forex Signals Copier, also from monitoring the live trading room, and of course from the full support in real time.
Resistance - R1 : 1.4372 | R2 : 1.4488 | R3 : 1.4548
Main Trend - Bearish
Intraday Trend - Bearish
The exchange rate GBPUSD accept very strong pressure all these days, as we can see on the 4H chart of forex technical analysis. On Friday price finally, close inside lower channel of Andrew's Pitchfork exactly on the bottom line. Is very clear that the price remains below EMA(50) and EMA(200). This point is critical for the next move because right now is acting as support.
We must consider that there are Bullish Harmonic Patterns on 1H, 4H, and Daily chart.
An upward reaction is possible, but in any case, we must filter the move in order to be sure that is a real and valid reaction.
Considering all the details from the charts of forex technical analysis we can detect all critical levels and trading targets for H1 and H4 timeframes:
4H Chart
The area 1.4360 – 1.4395 is a neutral zone.
Bullish scenario: If price moves upwards and close above the neutral zone, then the upward trading targets will be: 1.4440, 1.4500, 1.4545, 1.4580, 1.4620, 1.4665, 1.4720.
Bearish scenario: If price moves downwards and close below the neutral zone, then the downward trading targets will be: 1.4190, 1.4150, 1.4100, 1.4060, 1.4030.
1H Chart
The area 1.4290 – 1.4305 is a neutral zone.
Bullish scenario: If price moves upwards and close above the neutral zone, then the upward trading targets will be: 1.4320, 1.4345, 1.4365, 1.4390, 1.4415, 1.4445, 1.4470, 1.4500.
Bearish scenario: If price moves downwards and close below the neutral zone, then the downward trading targets will be: 1.4220, 1.4185, 1.4135.
There are Bullish Harmonic Patterns on 1H chart: nen Star [0886/0.786/2.236], on 4H chart: 1.618xAB=CD, on Daily chart: 1.618xAB=CD.
Using the above elements of forex technical analysis, everyone can plan his own personal forex trading strategy. We note the need to use stop-loss levels.
You agree with our estimates? If you have another point of view, you can write your opinion in comments.
You can subscribe to one of the four subscription packages and take advantage of all benefits of the forex signals using one of the most sophisticated Forex Signals Copier, also from monitoring the live trading room, and of course from the full support in real time.


No comments:
Post a Comment